March 2020, you can picture exactly where you were. I was living in Bangkok and couldn’t get a flight back to the US. Bangkok was on strict curfew and far too hot to spend the day outside. So I quickly learned that “idle hands are the devil’s workshop” as I created tvcharts.co
My original objective was to learn new coding skills (Docker and React hooks). But immediately after launching on Product Hunt and posting on Reddit I started receiving lots of traffic and feedback. I quickly became obsessed with reading discussions about my product, seeing the huge spikes in usage, and speaking directly with users for their insights on how to improve their experience.
What is tvcharts?
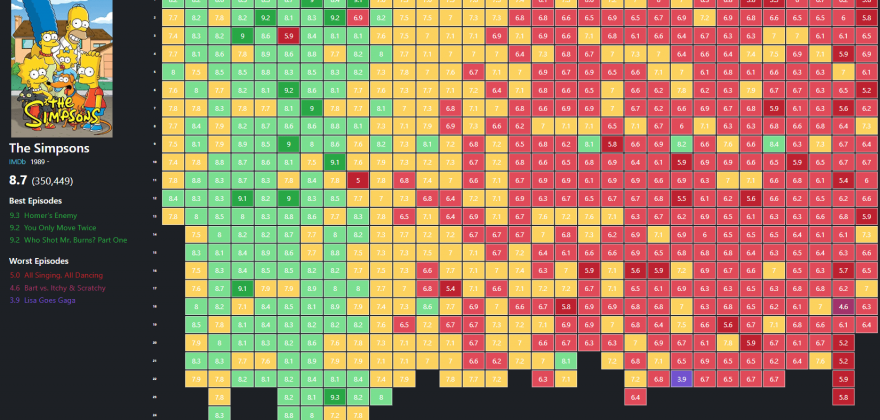
A visual representation of how well a tv show does in ratings for all seasons.
What do I know about tvcharts users?
By the numbers:
- 5k MAU from multiple countries and languages
- Avg session is 2min, visiting 2-3 pages per session
- 30% of users return on average about 3 times
- 60% of traffic comes from mobile
- Over the last 6 months, there has been 100% increase in direct traffic and 60% increase in branded organic search. This metric is interesting! What 💡 ideas can we get from it?
How can I improve tvcharts?
I have received a few ideas for new “cool” features from users that could be interesting. However, the recent increases in direct and branded search from returning visitors indicates there are loyal users of the product. So I believe there is a real opportunity to increase engagements from returning users which could also have growth potential by enabling existing users to advocate for us.
Who uses tvcharts?
There are both new and returning users interested in tv show ratings of currently active shows as well as completed shows.
I am really interested in learning how to improve the experience for returning users so they engage more or advocate the site to others.
What are some problems for these returning users?
- Watched / Watching / To Watch: As a loyal “dog eating” user myself and having chatted with a few others, I know that users want to see ratings for 3 distinct categories of shows:
- Shows they have watched before
- Shows they are currently watching
- A show they might want to watch
- Search: Finding a show requires you to know the name of a show (almost exactly)
- Discovery: There is no way to discover shows that you don’t know about
- Missing Data: Some shows don’t have IMDb ratings for all of the episodes, making the chart hard to see trend data and making the site look incomplete
- Favorites: Re-visiting a tvchart you have seen before cannot be done within the product, so unless you have a link or bookmark in your browser you have to search every time.
- Sharing: When you share a tvchart, it only includes a link and basic details. But there is no visual included and the site isn’t setup with the right metadata for social sites to pull it in automatically
Let’s explore what impact solving these might have
I like using sizes (Small, Medium, Large)
| Problem | Impact |
| Watch / Watching / To Watch | L – Having a list of shows you plan on watching later, or following along with ratings and reviews as you are watching, and seeing shows you have watched before would all bring people back to the site. |
| Search | M – Having a better partial match or keyword search could likely increase engagement. There is not significant dropoff on the search results page and people seem to substitute by using Google search |
| Discovery | L – Finding new, popular, and trending shows generates a lot of search results and likely engagements across many other substitute competitor sites and apps |
| Missing Data | S – This is a rare occurrence mostly for obscure shows |
| Favorites | L – Users following shows they are watching could easily access the charts |
| Sharing | M – This could provide a lot of growth potential. Some users currently post screenshots of the chart and share using the links provided. |
What are some solutions for these problems?
Also, how confident am I they will work and how much effort would they take?
| Solution | Effort | Confidence |
| Watchlists: Allow users to create and save shows to a list. These watchlists could solve for the watched/watching/to-watch and favorites problem. We could also make these publicly available and introduce tagging and custom naming which could be the foundation for a discovery system in the future as well. | M – The watchlist feature can start with a basic MVP favorites list L – Creating a more complex labeling system with custom list names | L – Creating watchlists provides engagement and data collection opportunities from users providing data |
| Recommended search results: A better results matching which should consider partial matches, misspellings, and keywords would make it easier to find shows. Although the first version can be simple and not include keyword searching if the data is not available | S – A regular expression and dictionary search matching and default list of shows in case of no results | M – We are not losing many users from bad search, but we do know people tend to give up when there are no results |
| Trending shows: Displaying recently released or most viewed shows could help people discover new shows to watch or follow along with shows currently airing. | L – Getting dates across all shows will require a sorting algorithm. Will need to access another API or track popularity data | S – Many users visit already completed shows and new show data isn’t realtime which could lead to support requests for frequently updating data that isn’t available yet |
| Share with images: Adding a visual component to the current share feature that also pulls in the data from social sites | S – Using puppeteer and OG metadata tags | M – Sharing links with images get more engagements on social, but we have few shares from links currently |
Now let’s prioritize
I used sizes so I can use the RICE scoring method, (although I simplified it to ICE – Impact, Confidence, Effort). The formula will help me prioritize the solution which will have the best opportunity to impact my goal of increasing engagement with returning users.
My prioritization formula is (Impact x Confidence) / Effort; assigning the following values S=1, M=2, L=3
| Solution | IC/E | Priority |
| Watchlists (basic MVP favorites) Watchlists (custom labeling) | (3×3) / 2 (3×3) / 3 | 4.5 1 |
| Recommended search results | (2×2) / 1 | 4 |
| Share with images | (2×2) / 1 | 4 |
| Trending shows | (3×1) / 3 | 1 |
Creating a Watchlist feature has the highest priority score. It’s important that we start with basic MVP functionality of saving favorites. This will address multiple pain points and save us from spending too many eng resources. We don’t want to build a complex Watchlist feature which we don’t know for sure will get adopted.
How will I know if adding a watchlists feature is successful?
Since I have no user login yet, I would consider the minimum criteria for success is validating if there is interest in creating a watchlist feature.
So I could use a “painted door” experiment where I add a “create watchlist” button that takes users to a preview page for watchlists. This page can include a basic description of this feature. But I will also include a survey or basic input that visitors to this page can give feedback on if and how they would like to use this feature.
What metrics will signal interest in adding this feature?
If my primary metric to move is engagement with returning users, then these secondary metrics will be the funnel I monitor:
- Awareness – # of Watchlist page visits
- Acquisition – Low bounce/exit rate on page, Time on page >2s
- Activation – Clicks “add to watchlist”
- Retention – % of users visiting 2+ pages in same session
- Revenue – # of clicks to Patreon
- Referral – Volume of direct traffic to Watchlist page from a referring source could indicate people share this page directly
Summary
I believe I can validate my hypothesis to increase engagements from existing traffic by running a “painted door” experiment with tvcharts that allows users to indicate whether they would be interested in creating a saved list of favorites called Watchlists.

